Independent buying guides for home air, water and safety.
As an Amazon Associate, Delozone earns from qualifying purchases.
Independent buying guides for home air, water and safety.
As an Amazon Associate, Delozone earns from qualifying purchases.

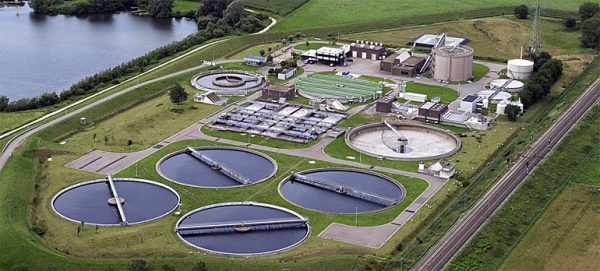

AOP drinking water treatment combines powerful oxidants to break down contaminants that resist conventional disinfection. The process relies on the generation of hydroxyl radicals, which react with a broad spectrum of organic and inorganic species.
Advanced oxidation processes are defined by the in‑situ production of hydroxyl radicals (·OH). These radicals possess a redox potential of approximately 2.8 V, making them one of the strongest oxidants available for water treatment. The radicals attack pollutants through hydrogen abstraction, electron transfer, or addition mechanisms, ultimately converting them to harmless end‑products such as carbon dioxide and water.
Typical AOP configurations pair a primary oxidant (ozone, hydrogen peroxide, or UV light) with a secondary catalyst or energy source. The interaction between the two components accelerates radical formation beyond what either could achieve alone. This synergistic effect allows treatment plants to target trace organic compounds, emerging contaminants, and resistant microorganisms.
Because hydroxyl radicals react indiscriminately, they can degrade a wide range of chemicals without the need for specific dosing strategies. This flexibility is especially valuable in municipal systems where influent composition can vary daily.
Early research on advanced oxidation began in the 1970s, focusing on laboratory‑scale applications for industrial wastewater. By the 1990s, pilot projects demonstrated that AOPs could meet stringent drinking‑water standards for disinfection by‑products (DBPs). Regulatory agencies such as the U.S. EPA and the European Union have since incorporated AOP performance metrics into guidance documents for water reuse and advanced treatment.
In the United States, the Safe Drinking Water Act encourages the use of technologies that reduce carcinogenic DBPs, and AOPs are frequently cited as an effective option. European directives on water quality also reference advanced oxidation as a method for achieving low concentrations of micropollutants. These policy frameworks have driven investment in full‑scale AOP plants across North America and Europe.
Today, many utilities adopt AOPs as a “polish” step after conventional filtration, ensuring compliance with both microbial and chemical standards. The technology continues to evolve, with newer catalyst formulations and reactor designs improving efficiency and cost‑effectiveness.
Traditional disinfection methods—chlorination, chloramination, and UV irradiation—primarily target microorganisms. While effective at inactivating bacteria and viruses, these methods can leave behind organic residues that form DBPs when combined with residual disinfectants.
AOPs differ by focusing on oxidation rather than simple inactivation. The generated hydroxyl radicals destroy the molecular structure of organic contaminants, preventing DBP formation at the source. This approach also reduces the need for high residual chlorine levels, which can cause taste and odor issues.
In practice, many utilities operate a hybrid system where conventional disinfection provides a safety net for pathogens, and an AOP stage removes precursors to DBPs. The combined strategy leverages the strengths of each technology while mitigating their individual drawbacks.
The O₃/H₂O₂ combination, often called “peroxone,” generates hydroxyl radicals through the reaction of ozone with hydrogen peroxide. This reaction proceeds rapidly under ambient temperature and pH conditions, making it suitable for large‑scale municipal plants.
Peroxone reactors typically employ a contact chamber where ozone gas is bubbled through a peroxide‑spiked water stream. The resulting radical concentration can be tuned by adjusting the ozone dose and peroxide concentration. Operators monitor residual ozone and peroxide to maintain optimal radical production without excess waste.
Field data show that peroxone can achieve >99 % removal of trace organic contaminants such as atrazine and bisphenol A at relatively low hydraulic retention times. The technology also provides a modest residual disinfectant effect, supporting downstream microbial safety.
UV/H₂O₂ AOPs rely on ultraviolet photons to split hydrogen peroxide into two hydroxyl radicals. The process is most efficient at UV wavelengths around 254 nm, which coincides with the absorption peak of H₂O₂.
Reactor designs often incorporate low‑pressure mercury lamps or LED arrays that deliver uniform UV fluence across the water stream. By controlling the peroxide concentration, plant operators can balance radical generation against cost and safety considerations.
UV/H₂O₂ is particularly effective for degrading pharmaceuticals and personal‑care products that resist chlorination. The technology also avoids the formation of ozone‑related by‑products, simplifying downstream treatment steps.
Photocatalysis uses titanium dioxide (TiO₂) as a solid catalyst that, when illuminated with UV light, produces hydroxyl radicals on its surface. The catalyst can be immobilized on plates, beads, or coated onto membranes, allowing continuous operation without catalyst loss.
Because TiO₂ is chemically stable and non‑toxic, it is attractive for long‑term deployment. The process benefits from the “self‑cleaning” nature of the catalyst, as organic fouling is oxidized away during operation.
Laboratory studies report that TiO₂ photocatalysis can achieve up to 90 % reduction of endocrine‑disrupting compounds within minutes. Scaling up to municipal flow rates requires careful design of UV intensity and catalyst surface area, but recent advances in LED technology have made large‑scale implementations more feasible.
Is Ozone Water Treatment Safe?
Choosing the appropriate reactor geometry is critical for ensuring uniform exposure of water to oxidants. Common configurations include plug‑flow tubes, mixed‑flow tanks, and cascade reactors, each offering distinct residence‑time distributions.
Hydraulic modeling helps predict short‑circuiting and dead zones that could reduce radical exposure. Computational fluid dynamics (CFD) simulations are frequently employed to optimize inlet and outlet placement, as well as mixing intensity.
In practice, designers aim for a hydraulic retention time (HRT) that balances treatment efficacy with plant throughput. Typical HRT values for AOP stages range from 5 to 30 seconds, depending on the target contaminant load and reactor type.
Accurate dosing of primary oxidants (ozone, hydrogen peroxide, or UV fluence) directly influences radical concentration. Kinetic models such as the Langmuir‑Hinshelwood equation or pseudo‑first‑order kinetics are used to predict contaminant removal under varying doses.
Real‑time monitoring of oxidant residuals enables feedback control loops that adjust dosing on the fly. Sensors measuring ozone concentration, peroxide levels, and UV intensity feed data into a supervisory control system.
Model validation is performed through pilot testing, where influent and effluent samples are analyzed for target compounds. The resulting data refine the kinetic parameters, improving the reliability of full‑scale operations.
Most utilities incorporate AOPs after coagulation‑flocculation and filtration, using the clarified water as feed. This placement reduces turbidity, which can otherwise quench hydroxyl radicals and lower treatment efficiency.
Downstream of the AOP stage, a polishing filter or activated carbon bed may be employed to capture any residual organic fragments. In some cases, a low‑dose chlorine or chloramine step follows to maintain a protective residual for distribution.
System integration also involves ensuring that downstream equipment can tolerate any residual oxidants. Materials selection—such as stainless steel or compatible polymers—prevents corrosion and prolongs equipment life.
Oxidant demand quantifies the amount of oxidant required to achieve a specific removal target. It is expressed as milligrams per liter (mg/L) of ozone or hydrogen peroxide consumed during the reaction.
Managing residuals is essential to avoid unintended oxidation in the distribution network. Operators typically aim for residual ozone levels below 0.1 mg/L and peroxide concentrations under 0.5 mg/L, complying with regulatory limits.
Continuous monitoring devices, such as amperometric ozone probes and spectrophotometric peroxide meters, provide real‑time data for process control. Automated alarms trigger dose adjustments when residuals exceed predefined thresholds.
While AOPs minimize traditional DBPs, they can generate secondary by‑products such as bromate when bromide is present. Bromate formation is a function of ozone dose, pH, and bromide concentration.
Control strategies include adjusting pH to neutral or slightly acidic values and limiting ozone exposure time. In some installations, a downstream ion exchange step removes bromide before AOP treatment.
Regular sampling for bromate, aldehydes, and other oxidation by‑products ensures compliance with drinking‑water standards. Laboratory methods such as ion chromatography and gas chromatography‑mass spectrometry (GC‑MS) are standard for this analysis.
Modern AOP plants leverage sensor networks that capture parameters like UV fluence, ozone concentration, and temperature. Data streams are aggregated in a central SCADA system for visualization and historical trending.
Advanced analytics, including machine‑learning models, can predict performance deviations before they manifest. Predictive maintenance schedules reduce unplanned downtime and extend equipment life.
Integration with cloud‑based platforms enables remote access for plant managers, facilitating rapid response to operational alerts. Secure data transmission complies with industry cybersecurity standards.
| Technology | Capital Cost (USD/kW) | Operating Cost (USD/m³) |
|---|---|---|
| O₃/H₂O₂ (Peroxone) | 1,200–1,500 | 0.03–0.07 |
| UV/H₂O₂ | 900–1,200 | 0.02–0.05 |
| TiO₂ Photocatalysis | 1,400–1,800 | 0.04–0.08 |
Capital costs reflect equipment, installation, and civil works. Operating costs include energy consumption, chemical procurement, and routine maintenance.
When evaluating total cost of ownership, utilities should consider the value of reduced DBP formation and compliance risk. In many cases, the modest increase in operating expense is offset by lower treatment fees and improved public health outcomes.
Energy use varies among AOP technologies, with UV‑based systems typically consuming more electricity due to lamp operation. Ozone generation also requires power for corona discharge, but the overall footprint can be mitigated by recovering waste heat.
Life‑cycle assessments show that AOPs can achieve a lower carbon intensity than chlorination when the avoided DBP treatment and sludge disposal are accounted for. Renewable energy integration, such as solar‑powered UV arrays, further reduces emissions.
Utilities aiming for carbon‑neutral operations often pair AOPs with on‑site renewable generation and energy‑storage solutions. This synergy supports both regulatory compliance and corporate sustainability goals.
A comprehensive lifecycle assessment (LCA) examines raw material extraction, manufacturing, operation, and end‑of‑life disposal. For AOPs, the most significant impacts arise from chemical production (hydrogen peroxide) and electricity consumption.
Strategies to improve sustainability include sourcing hydrogen peroxide from green‑chemistry routes and selecting high‑efficiency UV LEDs with longer lifespans. Recycling of catalyst materials, such as TiO₂, also contributes to waste reduction.
Overall, AOPs align with the growing demand for water‑treatment solutions that balance performance, cost, and environmental stewardship. Continued innovation in catalyst design and energy recovery will further enhance their sustainability profile.
AOPs target trace organic compounds such as pesticides, pharmaceuticals, and endocrine‑disrupting chemicals. These substances are often resistant to chlorine and may even form harmful by‑products when chlorinated.
Hydroxyl radicals break down these molecules into smaller, less toxic fragments, achieving removal efficiencies above 90 % for many contaminants.
Regulatory limits for residual ozone are typically set at 0.1 mg/L, while hydrogen peroxide limits are around 0.5 mg/L. Proper dosing and monitoring keep residuals well within these boundaries.
Residual oxidants can provide a secondary disinfectant effect, but they must be managed to avoid taste, odor, or material compatibility issues.
UV/H₂O₂ systems generally consume more electricity than standard UV reactors because of the additional peroxide dosing and higher UV fluence requirements.
However, the overall energy footprint may be lower when accounting for reduced chemical usage and downstream treatment needs.
Yes, AOP units are often installed after filtration and before final disinfection. This placement minimizes turbidity‑related quenching and integrates smoothly with existing control systems.
Retrofitting may require upgrades to hydraulic infrastructure and the addition of oxidant storage and dosing equipment.
Key challenges include maintaining optimal oxidant dosing, preventing by‑product formation such as bromate, and ensuring consistent UV lamp performance.
Effective monitoring, automated control loops, and regular maintenance schedules help mitigate these issues.
When properly managed, AOPs do not impart noticeable taste or odor. In fact, the removal of organic precursors can improve aesthetic qualities compared with chlorinated water.
Any residual oxidant levels are kept low enough to avoid perceptible effects on consumers.
Design phases typically span 12–18 months, including feasibility studies, pilot testing, and detailed engineering.
Construction and commissioning can be completed within an additional 6–12 months, depending on site conditions and regulatory approvals.
Research is advancing in areas such as plasma‑based oxidation and hybrid photocatalytic‑electrochemical systems. These technologies aim to increase radical yield while reducing energy consumption.
While still at the demonstration stage, early results suggest potential for higher efficiency and lower operational costs.
pH influences the speciation of oxidants and the stability of hydroxyl radicals. Slightly acidic conditions (pH 6–7) often maximize radical production for ozone‑based AOPs.
Adjusting pH can also help control by‑product formation, especially bromate in bromide‑rich waters.
Integrating AOPs with ultrafiltration or nanofiltration can provide a two‑stage barrier, removing both dissolved contaminants and suspended solids.
The AOP stage reduces fouling potential for downstream membranes, extending their service life and reducing cleaning frequency.
The Delozone Editorial Team researches water treatment, pool and spa, and indoor air products for independent buying guides. We compare products using manufacturer specifications, certification listings such as NSF/ANSI, UL, AHAM and Energy Star, published third-party test data and verified owner feedback. We do not sell products, and affiliate commissions never decide what we recommend.