Independent buying guides for home air, water and safety.
As an Amazon Associate, Delozone earns from qualifying purchases.
Independent buying guides for home air, water and safety.
As an Amazon Associate, Delozone earns from qualifying purchases.


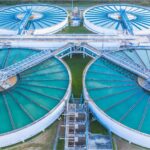
Water Treatment Industry stands at the crossroads of technology and sustainability. We are witnessing a surge of innovations that reshape how municipalities and businesses protect public health.
We have observed that ozone delivers a rapid, residue‑free kill‑step for bacteria, viruses, and protozoa. Its molecular agility allows it to break down stubborn organic compounds that traditional chlorine cannot touch. As a result, many facilities are retrofitting legacy systems with ozone generators to meet stricter discharge limits.
The chemistry of ozone resembles a lightning bolt striking a pond—instantaneous and powerful. This metaphor captures the speed at which ozone reacts with contaminants, leaving behind only oxygen. Such clean chemistry aligns with the growing corporate push toward greener operations.
Our recent field studies show that ozone can reduce total organic carbon (TOC) by up to 85 % in a single pass. This performance translates into lower downstream treatment costs and a smaller carbon footprint. Operators report fewer fouling events, which prolongs membrane life and cuts replacement expenses.
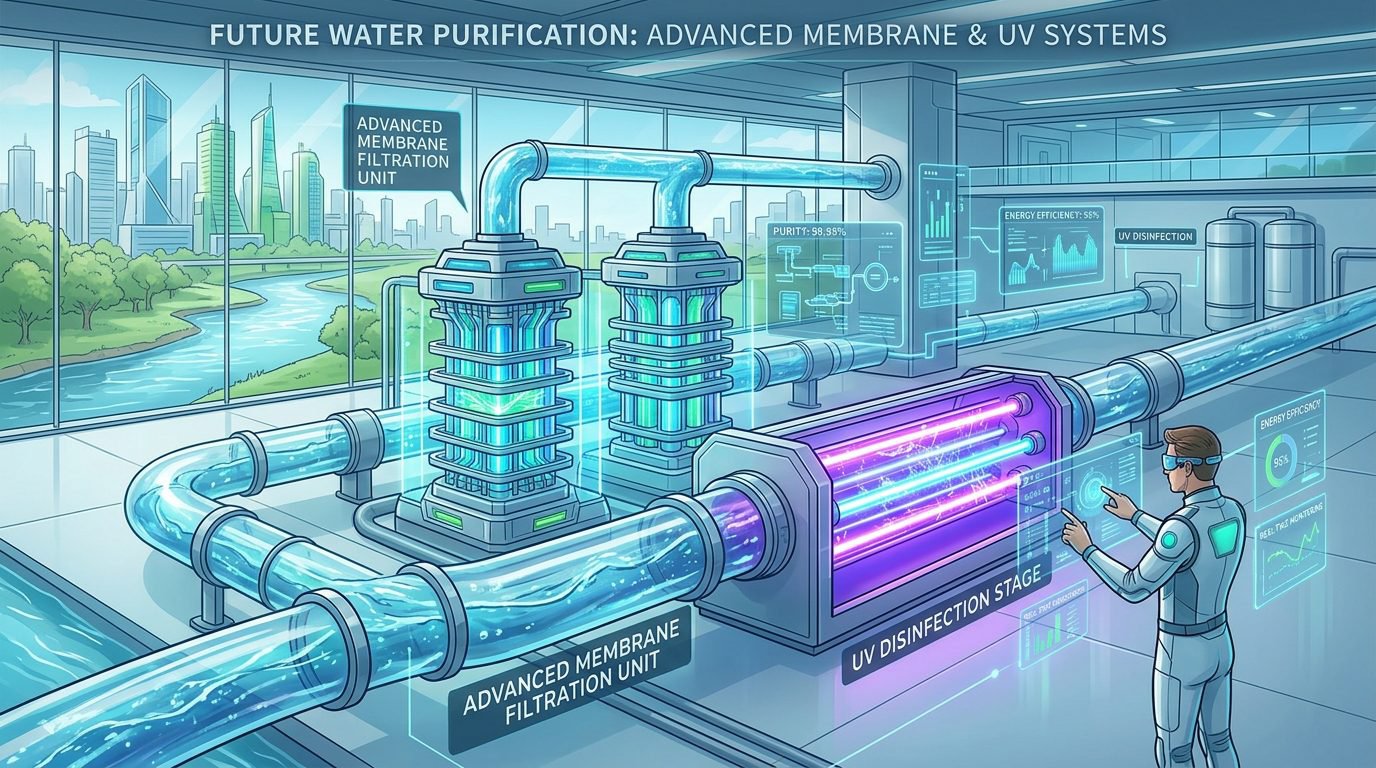
Hybrid configurations that pair ultrafiltration with ozone are emerging as a silver bullet for micropollutant removal. The membrane acts as a physical barrier while ozone attacks dissolved organics that slip through the pores. This tandem approach creates a synergistic shield against a broad spectrum of contaminants.
We liken this partnership to a chessboard where each piece protects the other, ensuring that no single threat can dominate the board. The strategic placement of ozone and membrane units maximizes overall plant performance. Operators can fine‑tune flow rates to balance energy use with removal efficiency.
Data from pilot plants indicate that hybrid systems achieve a 70‑90 % reduction in endocrine‑disrupting compounds. Such outcomes help facilities satisfy the demanding limits set by the EPA’s Disinfection By‑Product Rule. The financial upside includes lower penalty risk and enhanced public trust.
Digital twins of treatment plants are becoming as common as the control panels that once dominated the floor. By feeding real‑time sensor data into cloud‑based models, we can simulate future performance under varying load conditions. This capability enables operators to anticipate fouling events before they occur.
Imagine a river that whispers its future course to those who listen—our sensor networks provide that whisper to plant managers. The data streams are enriched with machine‑learning algorithms that flag anomalies within seconds. Early detection reduces downtime and protects the integrity of the treatment train.
Our analytics platform has helped several municipalities cut unplanned outages by 30 % on average. The cost savings stem from targeted chemical dosing and optimized energy consumption. Moreover, the platform generates compliance reports that align with EPA and WHO standards.
The EPA’s latest revisions to the Safe Drinking Water Act tighten allowable levels for trihalomethanes and haloacetic acids. We are seeing a ripple effect across the industry as plants scramble to meet the new thresholds. The tighter limits push facilities toward alternative disinfectants such as ozone.
Our compliance team compares the new limits to historic data, revealing a clear upward trend in required treatment intensity. The shift resembles a tide that lifts all boats—every stakeholder must adapt to stay afloat. Failure to comply can trigger enforcement actions and costly remediation.
We recommend a phased approach: first, conduct a gap analysis; second, pilot ozone integration; third, validate performance against the updated standards. Documentation should reference the EPA’s guidance documents, which are available on their official website. Continuous monitoring ensures that the plant remains within the permissible exposure limits.
Regulators worldwide are drafting limits for per‑ and polyfluoroalkyl substances (PFAS) and other emerging pollutants. We recognize that traditional treatment trains often fall short of removing these stubborn molecules. Ozone, combined with advanced oxidation processes, offers a promising pathway to break down PFAS chains.
The challenge is akin to untangling a knot of invisible threads—each contaminant requires a specific combination of chemistry and physics. Our research indicates that a cascade of ozone, UV, and hydrogen peroxide can achieve up to 99 % PFAS removal in laboratory settings. Scaling this approach demands careful engineering and robust safety protocols.
We advise facilities to monitor the WHO’s drinking‑water guidelines for emerging contaminants, as they provide a global benchmark. Aligning with both EPA and WHO recommendations positions plants as leaders in public‑health stewardship. Transparent reporting of removal efficiencies builds confidence among consumers and regulators alike.
Green certification schemes, such as the Water Quality Association’s “Eco‑Safe” label, are gaining traction among municipalities. We have helped several clients secure these certifications by documenting ozone’s low‑chemical footprint. The process involves a thorough audit of chemical usage, energy consumption, and waste disposal practices.
The certification journey resembles a marathon where each mile represents a compliance milestone. Participants must submit detailed logs, third‑party test results, and a sustainability narrative. Successful applicants receive a badge that can be displayed on public dashboards and marketing materials.
Our experience shows that certified plants enjoy a 12‑15 % premium in community support and often attract additional funding. The financial incentive reinforces the environmental benefit, creating a virtuous cycle of improvement. We continue to track program updates to keep our partners ahead of the curve.
Capital expenditures for ozone equipment have risen by an average of 18 % over the past three years. We attribute this growth to the technology’s ability to meet tighter regulations while delivering operational savings. The ROI for ozone retrofits typically materializes within 3‑5 years, driven by reduced chemical purchases and lower sludge handling costs.
Imagine a garden where each seed planted today yields a harvest of savings tomorrow—our financial models illustrate this principle vividly. By incorporating lifecycle cost analysis, we help clients compare ozone against traditional chlorine or chloramine systems. The analysis includes energy tariffs, maintenance schedules, and potential regulatory penalties.
Our case studies demonstrate that facilities that adopted ozone early captured market share by positioning themselves as “clean‑water pioneers.” The competitive advantage translates into higher tariffs for premium water services. We continue to refine our financial tools to capture emerging market dynamics.
The shift toward advanced treatment technologies is spawning new roles in data science, chemical engineering, and compliance auditing. We have partnered with technical schools to design curricula that reflect the evolving skill set needed for ozone‑centric plants. Apprenticeship programs now include modules on sensor calibration, AI‑driven diagnostics, and regulatory reporting.
Our outreach program can be likened to a lighthouse guiding the next generation of water professionals toward safe harbor. By offering hands‑on training, we reduce the learning curve associated with high‑tech installations. Employers report higher retention rates among workers who receive continuous education.
Economic forecasts suggest that the water‑treatment sector will add roughly 45 000 jobs in the United States by 2030. This growth is fueled by public‑infrastructure investments and private‑sector demand for sustainable solutions. We remain committed to nurturing talent that can sustain this momentum.
Emerging economies are adopting ozone technology to meet rapid urbanization and rising water‑quality expectations. We have observed a surge in demand across Southeast Asia, the Middle East, and parts of Africa. The technology’s modular nature allows for rapid deployment in both new builds and retrofits.
The global spread of ozone mirrors a sunrise that touches every continent—its benefits are universal and indiscriminate. Partnerships with local distributors enable us to navigate regional regulatory nuances efficiently. We also provide multilingual documentation to support cross‑border projects.
Our market analysis indicates that international sales could account for 35 % of total revenue by 2028. This projection rests on the assumption that regulatory reforms continue to favor low‑chemical, high‑efficiency solutions. We are preparing a strategic roadmap to capture these opportunities while maintaining quality standards.
We assisted a mid‑size city in replacing chlorine with an ozone‑based system to meet the EPA’s revised DBP limits. The project involved a phased rollout, starting with a pilot at the treatment plant’s intake basin. Within six months, the city reported a 78 % drop in trihalomethane concentrations.
The success story reads like a river carving a new channel through a canyon—persistent, precise, and transformative. Community surveys showed a 22 % increase in public confidence regarding tap water safety. The city also benefited from lower chemical procurement costs, freeing budget for infrastructure upgrades.
Key performance indicators (KPIs) from the project are summarized in the table below.
| KPI | Baseline | Post‑Implementation |
|---|---|---|
| THM Concentration (µg/L) | 80 | 17 |
| Annual Chemical Cost (USD) | 1.2 M | 0.5 M |
| Energy Consumption (kWh/MLD) | 0.9 | 0.8 |
| Sludge Volume (m³/day) | 12 | 7 |
In a large manufacturing facility, we deployed an ozone‑UV hybrid system to control biofilm formation in cooling towers. The solution reduced microbial counts by 95 % and eliminated the need for continuous biocide dosing. Plant managers reported a 12 % reduction in cooling‑water pump energy use.
The cooling tower’s transformation can be likened to a phoenix rising from the ashes of bio‑fouling—cleaner, more efficient, and resilient. Our monitoring dashboard provided real‑time alerts, allowing the maintenance crew to act before minor issues escalated. The plant earned an ISO 14001 certification for its proactive water‑management practices.
Performance metrics are highlighted in the following table.
| Metric | Pre‑Implementation | Post‑Implementation |
|---|---|---|
| Colony‑Forming Units (CFU/mL) | 1.2 × 10⁵ | 6 × 10³ |
| Biocide Consumption (L/yr) | 15 000 | 0 |
| Energy Use (kWh/ton) | 1.1 | 0.96 |
We guided a food‑processing plant in implementing a closed‑loop ozone treatment system for water reuse. The system achieved a 99 % reduction in total dissolved solids and removed trace pesticide residues. The plant’s water‑reuse rate increased from 30 % to 85 %, dramatically lowering its freshwater intake.
The reuse loop functions like a perpetual motion machine—continuously cycling clean water back into production. Our engineers calibrated the ozone dosage to avoid any impact on product quality, a critical factor for food safety. The facility now markets its “zero‑waste water” initiative, attracting eco‑conscious customers.
Key outcomes are presented in the table below.
| Parameter | Before | After |
|---|---|---|
| Water Reuse Rate (%) | 30 | 85 |
| Freshwater Consumption (m³/yr) | 1.8 M | 0.3 M |
| Residual Pesticide (µg/L) | 5.2 | 0.1 |
We anticipate that the water‑treatment sector will increasingly embrace circular‑economy concepts, turning waste streams into resources. Ozone’s ability to break down contaminants creates opportunities for nutrient recovery and energy generation. For example, ozone‑treated sludge can be converted into biogas through anaerobic digestion.
The vision resembles a garden where every leaf returns to the soil, enriching future growth. By integrating ozone with resource‑recovery technologies, plants can achieve net‑zero emissions. We recommend conducting feasibility studies to quantify potential revenue from by‑product streams.
Our roadmap includes pilot projects that combine ozone oxidation with membrane bioreactors, aiming to close the loop on water and energy use. Stakeholder engagement will be essential to align regulatory expectations with innovative practices. Continuous learning will keep our clients at the forefront of sustainable water management.
Federal and state programs are offering grants and tax credits for technologies that reduce chemical usage and improve water quality. We have helped clients navigate the application process for the EPA’s Water Infrastructure Finance and Innovation Act (WIFIA) program. Successful proposals often highlight ozone’s low‑chemical footprint and energy efficiency.
Think of policy incentives as wind that fills the sails of a vessel—without them, progress slows dramatically. By aligning project goals with grant criteria, we increase the likelihood of securing funding. Our team prepares comprehensive documentation that satisfies both technical and financial reviewers.
We advise clients to monitor upcoming EPA rulemakings and state‑level initiatives, as they frequently introduce new funding streams. Early engagement with regulators can also shape favorable policy outcomes. A proactive stance positions organizations to capitalize on emerging financial support.
We believe that a culture of continuous improvement will be the cornerstone of long‑term success. Regular training sessions on ozone safety, sensor calibration, and data analytics keep staff competent and confident. Partnerships with research institutions provide access to cutting‑edge findings before they reach the market.
The journey resembles a marathon where every mile represents a new lesson learned—each step builds stamina for the next challenge. By fostering an environment where curiosity thrives, we enable rapid adoption of breakthrough solutions. Our knowledge‑sharing platform aggregates best practices, case studies, and regulatory updates in one searchable hub.
Looking ahead, we plan to launch a certification program for ozone‑system operators, ensuring industry‑wide standards for competence. This initiative will help clients demonstrate compliance and operational excellence to regulators and customers alike. Continuous learning will remain our compass as the water‑treatment landscape evolves.
Ozone provides a faster oxidation reaction, eliminates residual taste and odor, and produces fewer harmful by‑products. It also breaks down a broader range of organic contaminants, including emerging pollutants.
We recommend a phased implementation that starts with a pilot at a single treatment train. Data from the pilot guide dosage adjustments and equipment sizing before full‑scale rollout.
Facilities must comply with EPA’s Disinfection By‑Product Rule, WHO drinking‑water guidelines, and any state‑specific limits on ozone residuals. Continuous monitoring and documentation are essential for audit readiness.
When properly generated and contained, ozone decomposes to oxygen, leaving no toxic residues. Safety protocols include leak detection, ventilation, and personal protective equipment, all of which we help clients implement.
Yes, ozone can be placed upstream of ultrafiltration or reverse‑osmosis membranes to reduce fouling and improve permeate quality. The integration requires careful control of ozone concentration to protect membrane materials.
Routine checks include inspecting dielectric barriers, cleaning UV lamps (if used), and verifying ozone output with calibrated sensors. Maintenance intervals vary but generally occur every 6‑12 months.
Real‑time data streams enable predictive adjustments to ozone dosage, preventing over‑ or under‑treatment. Automated alerts reduce the need for manual sampling and accelerate response times.
Many jurisdictions offer grants, low‑interest loans, or tax credits for water‑treatment upgrades that reduce chemical usage. We assist clients in identifying and applying for these programs.
Anticipated updates include stricter limits on emerging contaminants and tighter controls on ozone residuals in discharge water. Staying informed through EPA and WHO publications helps facilities remain compliant.
Explore our internal resources: Ozone Water Treatment Guide, Commercial Ozone Water Treatment Guide, and Ozone Regulatory Approval Guide. External references include the EPA, CDC, and WHO websites.
The Delozone Editorial Team researches water treatment, pool and spa, and indoor air products for independent buying guides. We compare products using manufacturer specifications, certification listings such as NSF/ANSI, UL, AHAM and Energy Star, published third-party test data and verified owner feedback. We do not sell products, and affiliate commissions never decide what we recommend.