Physical Address
304 North Cardinal St.
Dorchester Center, MA 02124
Physical Address
304 North Cardinal St.
Dorchester Center, MA 02124


Public health water treatment stands at the crossroads of science, safety, and society. We explore how modern disinfection methods protect communities while honoring regulatory and.
Waterborne illnesses have haunted humanity since ancient times, yet modern surveillance has turned the tide. We track outbreaks through a network of laboratories, hospitals, and public‑health agencies, creating a tapestry of data that guides intervention. The patterns that emerge resemble a storm‑cloud map, highlighting hotspots where prevention is most needed.
Recent CDC reports indicate that bacterial gastroenteritis accounts for roughly 40 % of reported cases in the United States. Viral agents such as norovirus and hepatitis A follow closely, especially in regions with aging infrastructure. By comparing incidence rates across states, we can pinpoint where treatment upgrades will have the greatest impact.
Our analysis shows that low‑income neighborhoods experience a disproportionate burden, a reminder that clean water is a social as as well as a scientific issue. Addressing these disparities requires coordinated policy, targeted funding, and community partnership.
Microbes possess a toolbox of survival tricks, from protective cysts to biofilm formation. These adaptations allow them to linger in distribution systems, waiting for a chance to infect. Like a thief hiding in the shadows, they exploit any lapse in disinfection.
Research from the WHO highlights that temperature, pH, and organic load dramatically influence pathogen persistence. For example, Legionella thrives in warm, stagnant water, while Cryptosporidium resists chlorine but succumbs to oxidative stress. Understanding these nuances enables us to tailor treatment protocols with surgical precision.
We also consider the role of emerging contaminants such as antibiotic‑resistant bacteria. Their presence signals an evolving threat that demands innovative solutions beyond traditional chlorination.
Children, the elderly, and immunocompromised individuals stand at the front line of water‑borne risk. A single contaminated sip can cascade into severe illness, hospital stays, and even loss of life. Their stories echo the urgency of our mission.
Data from the EPA’s Safe Drinking Water Act enforcement actions reveal that municipalities with robust treatment systems report lower hospitalization rates among these groups. This correlation underscores the protective power of diligent water management.
We champion policies that prioritize equity, ensuring that every household—whether in a bustling metropolis or a remote hamlet—receives water that is clean, clear, and safe.
Ozone, a tri‑atomic form of oxygen, acts like a lightning strike against microorganisms. Its powerful oxidation potential ruptures cell walls, denatures proteins, and fragments nucleic acids. The result is rapid, irreversible inactivation.
Studies published by the CDC demonstrate that ozone can achieve a 4‑log reduction of E. coli within seconds, outperforming chlorine in many scenarios. This speed is especially valuable during emergency response when time is a scarce commodity.
We also note that ozone decomposes back to oxygen, leaving no lingering chemical footprints. This attribute aligns with our commitment to environmental stewardship.
When we stack ozone against chlorine, the differences sparkle like a duel of swords. Ozone excels at neutralizing protozoa such as Giardia and Cryptosporidium, which are notoriously chlorine‑resistant. Chlorine, however, remains a workhorse for routine residual protection.
Our cost‑benefit tables (see below) illustrate that while ozone systems require higher upfront capital, the reduction in by‑product treatment and longer equipment life can offset initial expenses over a ten‑year horizon.
Choosing the right tool depends on water quality, regulatory mandates, and community expectations. A hybrid approach often yields the most balanced outcome.
Ozone generation occurs on‑site, eliminating the need for hazardous transport and storage. The process is enclosed, and automatic shut‑offs guard against over‑exposure, making the technology as safe as a well‑guarded vault.
One concern is the formation of bromate when ozone reacts with bromide ions. We mitigate this by optimizing contact time and employing activated carbon polishing, a strategy endorsed by the WHO.
Regular monitoring of dissolved ozone concentrations ensures compliance with EPA limits, protecting both public health and the environment.
For deeper guidance on ozone applications, explore our resources:
The EPA’s National Primary Drinking Water Regulations set the baseline for contaminant limits across the nation. We align our treatment designs with these standards, ensuring that every gallon meets or exceeds the required purity.
CDC recommendations on outbreak response emphasize rapid detection, source identification, and immediate remediation. Ozone’s swift action dovetails with these protocols, providing a powerful ally in emergency scenarios.
Internationally, the WHO’s Guidelines for Drinking‑Water Quality serve as a global compass, shaping best practices beyond U.S. borders. Our compliance matrix references these documents to guarantee worldwide relevance.
State agencies often impose stricter limits on specific contaminants, reflecting regional water‑source characteristics. We conduct gap analyses to reconcile federal and state requirements, crafting a unified compliance pathway.
Local health departments conduct routine sampling, and the data feed into public dashboards that promote transparency. This openness builds trust, turning water utilities into community partners.
We maintain a living document of regulatory updates, allowing us to pivot quickly when new standards emerge.
Countries such as Canada, Australia, and members Union have adopted ozone in municipal systems, reporting reduced incidence of water‑borne disease. Their case studies provide a treasure trove of lessons that we adapt for domestic use.
WHO’s risk‑based approach encourages nations to assess local hazards and select appropriate technologies. Ozone’s versatility makes it a strong candidate for diverse water‑quality challenges.
By benchmarking against global peers, we keep our strategies sharp and forward‑looking.
Before installing ozone, we map existing pipelines, storage tanks, and treatment stages. This survey resembles a topographic expedition, revealing hidden valleys and peaks that influence system design.
Our engineers employ hydraulic modeling to predict flow dynamics, ensuring that ozone contact time meets efficacy targets. The models are calibrated with real‑world data from pilot studies.
Stakeholder workshops bring together utility managers, public‑health officials, and community leaders, fostering a shared vision for clean water.
Financial modeling compares capital expenditure, operating costs, and projected savings from reduced disease burden. The table below summarizes a typical 5‑million‑gallon‑per‑day plant.
| Parameter | Ozone System | Chlorine System |
|---|---|---|
| Initial Capital ($) | 2,200,000 | 1,500,000 |
| Annual Operating ($) | 150,000 | 210,000 |
| By‑product Treatment Cost ($) | 30,000 | 85,000 |
| Estimated Health‑Cost Savings ($/yr) | 120,000 | 70,000 |
| Payback Period (years) | 6.5 | 9.2 |
The analysis shows that while ozone demands a higher upfront outlay, its lower operating expenses and health‑cost savings shorten the payback horizon.
We also factor in intangible benefits such as improved public perception and compliance ease.
Effective operation hinges on skilled personnel. We deliver hands‑on workshops that blend theory with real‑world troubleshooting, turning novices into confident operators.
Public outreach campaigns use clear graphics and plain language to explain why ozone is safe and beneficial. These messages echo through schools, civic meetings, and social media, creating a chorus of informed citizens.
Feedback loops—surveys, hotlines, and town halls—allow us to refine processes, ensuring that the system evolves with community needs.
Beyond ozone alone, hybrid oxidation techniques combine UV light, hydrogen peroxide, and ozone to forge hydroxyl radicals—nature’s most aggressive oxidants. This cocktail can dismantle stubborn contaminants such as pharmaceuticals and endocrine disruptors.
Pilot projects in Europe demonstrate that these processes achieve over 99 % removal of trace organics, a milestone that reshapes water‑quality expectations.
We are testing modular reactors that can be retrofitted into existing plants, offering a pathway to upgrade without massive reconstruction.
Internet‑of‑Things sensors now stream real‑time data on ozone concentration, residual chlorine, turbidity, and microbial counts. The data flow resembles a river of insight, guiding instantaneous adjustments.
Machine‑learning algorithms predict demand spikes and potential fouling events, allowing pre‑emptive maintenance. This predictive capability reduces downtime and extends equipment life.
Integration with municipal dashboards provides citizens with transparent water‑quality dashboards, turning numbers into narratives of safety.
Legislators are drafting amendments that recognize ozone’s low‑by‑product profile, potentially granting expedited approvals for new installations. These policy shifts could accelerate adoption across underserved regions.
International trade agreements now include provisions for sustainable water‑treatment technologies, opening markets for ozone equipment manufacturers.
We stay ahead of the curve by participating in standards committees, ensuring that future regulations reflect both scientific rigor and practical feasibility.
Ozone delivers rapid pathogen kill rates, leaves no residual chemicals, and can be generated on‑site, minimizing transport hazards. Its oxidative strength dismantles a wide spectrum of microbes, including chlorine‑resistant protozoa.
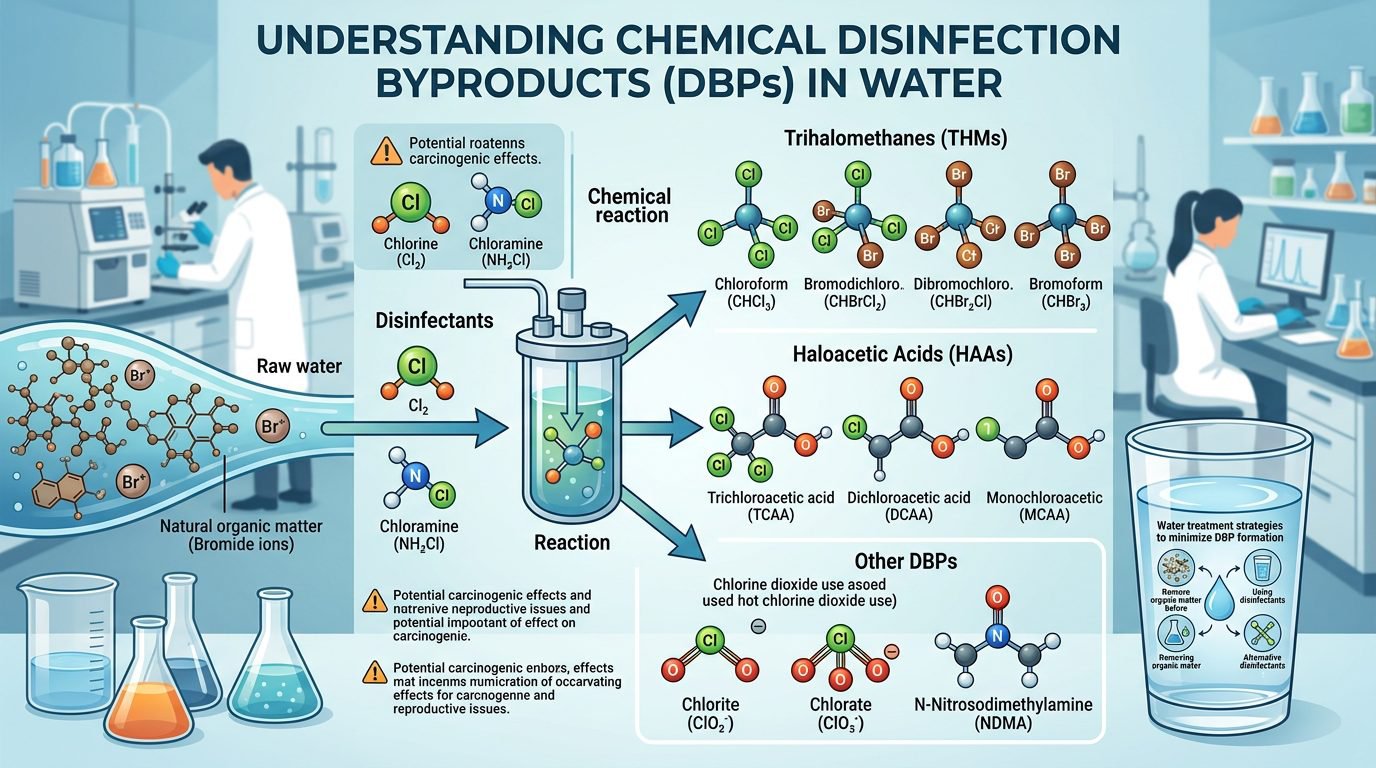
Chlorination can produce trihalomethanes (THMs) and haloacetic acids (HAAs), both of which are regulated due to health concerns. Ozone primarily yields oxygen and, when bromide is present, bromate—an issue that can be managed through proper system design.
High organic loads and low pH can reduce ozone’s oxidation efficiency. Pre‑treatment steps such as filtration and pH adjustment help maintain optimal performance.
The EPA sets national standards, while the CDC provides guidance on outbreak response. Internationally, the WHO offers best‑practice recommendations that many countries adopt.
Conduct a life‑cycle cost analysis that includes capital costs, operating expenses, by‑product treatment, and health‑cost savings. Our comparative table illustrates typical payback periods and long‑term benefits.
Operators need to understand ozone generation, safety protocols, and monitoring techniques. Certification programs often combine classroom instruction with hands‑on equipment drills.
Ozone can improve taste and odor by oxidizing organic compounds that cause off‑flavors. Any residual ozone is quickly converted to oxygen, leaving water with a neutral profile.
Yes, hybrid systems that pair ozone with UV or chlorine can provide residual protection while leveraging ozone’s rapid kill rate. Such combinations are increasingly common in advanced treatment plants.
Because ozone decomposes to oxygen, it does not introduce persistent chemicals into the environment. Energy consumption is the primary consideration, and modern generators are designed for high efficiency.
Ozone’s strong oxidative power breaks down many pharmaceutical molecules that resist conventional treatment. When paired with advanced oxidation processes, removal rates can exceed 90 % for a wide range of compounds.
James Crawford brings 20 years of hands-on experience in commercial water systems, from aquatics facilities to industrial wastewater treatment. He covers system sizing, regulatory compliance, and evaluates ozone equipment for large-scale operations.